Nomad eSIM
News
US Travel Trends Statistics 2026
The key travel trends shaping where, how and why Americans travel in 2026.

US travel spending is forecast to reach $1.37 trillion in 2026, though real growth is slowing to 1%. Domestic trips remain the core of the market, while road travel, AI planning tools, event tourism and outdoor stays are changing how Americans plan and spend.
Report Highlights
- US travel spending is forecast to reach $1.37 trillion in 2026, up 1% after inflation.
- Domestic travel is forecast to supply about 87% of 2026 US travel spending, worth roughly $1.19 trillion.
- In 2025, 64% of US travelers said they had taken a road trip in the previous 12 months, the highest share in over a decade.
- A projected 81.8 million Americans were forecast to travel at Thanksgiving 2025, 1.6 million more than the 2024 forecast.
- US summer vacation spending was projected at $226.6 billion in 2025, more than double 2019's $101.7 billion.
- National parks logged 331.9 million recreation visits in 2024, up 6.4 million on 2023.
- International visitors spent $253.9 billion in the US in 2024, up more than 12% on 2023.
Overall Travel Spending and Volume


Travel spending in the US has moved past its pre-pandemic peak in real terms, but the pace of growth is flattening.
Spending and economic scale
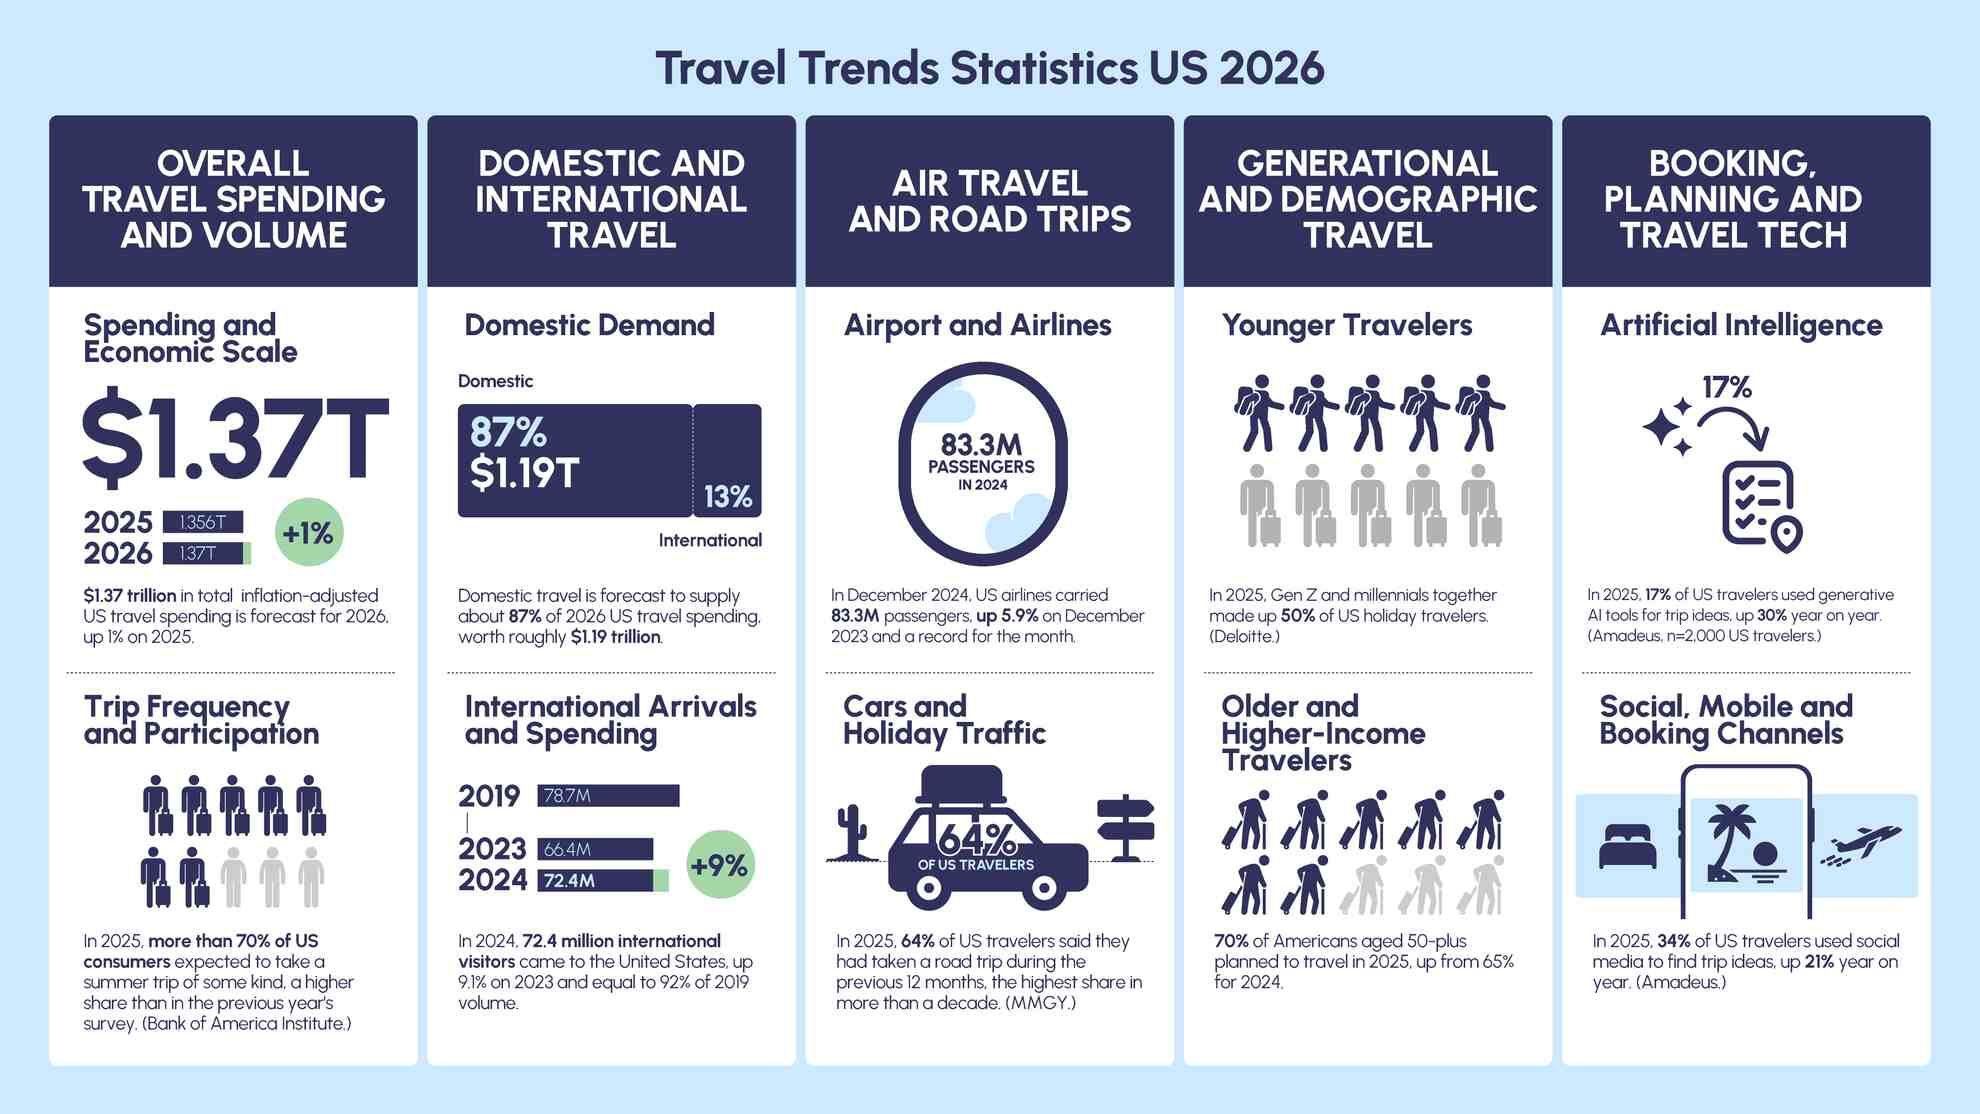
- $1.37 trillion in total inflation-adjusted US travel spending is forecast for 2026, up 1% on 2025.
- US summer vacation spending was projected at $226.6 billion in 2025, up 2.3% on 2024 and more than double the $101.7 billion spent in 2019. (Allianz Partners/Ipsos consumer intent survey — a projection from stated plans, not measured spending.)
- Anticipated summer vacation spending averaged $2,867 per household in 2025, up from $2,843 in 2024. (Allianz Partners/Ipsos.)
- Across the full year, planned travel spending reached $5,138 per traveler in 2025. (MMGY consumer survey.)
Trip frequency and participation
Participation rates and vacation counts show how travel intent is spread across the year. All four are stated plans.
- In 2025, more than 70% of US consumers expected to take a summer trip of some kind, a higher share than in the previous year's survey. (Bank of America Institute.)
- In 2025, 53% of Americans planned a summer leisure vacation using paid lodging, up from 48% in 2024. (Deloitte.)
- In 2025, Americans planned 4.2 vacations on average over the following 12 months. (MMGY.)
- In 2025, average planned holiday trips fell to 1.83, down from 2.14 in 2024. (Deloitte.)
Domestic and International Travel
Domestic trips still carry the overwhelming share of US travel spending, while inbound demand has recovered unevenly since 2019.
Domestic demand Domestic travel is the part of the market that has fully recovered in real terms.
- Domestic travel is forecast to generate about 87% of total US travel spending in 2026.
- Domestic travel spending is forecast at roughly $1.19 trillion for 2026 — rounded to $1.2 trillion by U.S. Travel — back at its inflation-adjusted 2019 level.
- Forecast domestic spending outweighs forecast international visitor spending of $178 billion by about 6.7 to 1 in 2026.
International arrivals and spending Inbound volume and spending both grew in 2024 but stayed below the 2019 benchmark, and the 2026 forecast sits below both.
- In 2024, 72.4 million international visitors came to the United States, up 9.1% on 2023 and equal to 92% of 2019 volume.
- In 2024, international visitors spent $253.9 billion in the United States, up more than 12% on 2023.
- In 2024, 35.2 million overseas visitors — excluding Canada and Mexico, air arrivals only — stayed 17.5 nights on average and spent $1,802 per visitor on the categories covered by the survey. This is a narrower measure than the $253.9 billion total above and the two should not be divided against each other.
- In 2024, the top 12 inbound markets supplied 78% of all US arrivals.
- In 2025, 35% of US travelers planning a trip within six months expected to go abroad. (MMGY.)
Reading the inbound numbers together. The 2026 forecast of 70.6 million arrivals (see 2026 Outlook) is below the 72.4 million recorded in 2024, because arrivals are forecast to have fallen in 2025 before resuming growth. The "up 3.4%" in that forecast is growth on 2025, not on 2024. Forecasters also disagree: the National Travel and Tourism Office's March 2025 projection for 2026 was considerably more optimistic than U.S. Travel's, so treat any single 2026 arrivals number as one view rather than a settled figure.
Air Travel and Road Trips
Air and road travel both set records through 2024 and 2025, with security checkpoints and holiday highways hitting new peaks.
Airports and airlines
Passenger volume records clustered tightly across a single 18-month window.
- In December 2024, US airlines carried 83.3 million passengers, up 5.9% on December 2023 and a record for the month.
- In 2025, nearly 3.1 million travelers passed US airport security on 22 June, a daily record at the time. (TSA data reported by Airlines for America.)
- As of late August 2025, 7 of the 10 busiest days in airport screening history had occurred that year. (TSA data reported by Airlines for America.)
- In 2025, 61% of US travelers said they favored airport biometrics over repeated document checks. (Amadeus, n=2,000 US travelers.)
- In 2025, 38% of US travelers named lost travel documents a top airport concern, ahead of 35% for luggage and 33% for queues. (Amadeus — a multi-select question, so responses total more than 100%.)
Cars and holiday traffic Driving continues to absorb the bulk of holiday travel, largely on cost grounds.
- In 2025, 64% of US travelers said they had taken a road trip during the previous 12 months, the highest share in more than a decade. (MMGY.)
- In 2025, 71% of summer travelers planned a road trip, up from 66% in 2024. (Deloitte.)
- At Thanksgiving 2025, at least 73 million Americans were projected to drive, nearly 90% of the 81.8 million total projected holiday travelers. (AAA forecast.)
- In 2025, 57% of holiday travelers who chose to drive rather than fly said they did so to save money, up from 47% in 2024. (Deloitte.)
Generational and Demographic Travel
Younger and older travelers are pulling the market in different directions, one toward trip volume and the other toward spend.
Younger travelers
- In 2025, Gen Z and millennials together made up 50% of US holiday travelers. (Deloitte.)
Older and higher-income travelers Travelers aged 50 and over raised both their trip intent and their budgets. All four figures come from AARP research fielded in November–December 2024 and published for 2025.
- 70% of Americans aged 50-plus planned to travel in 2025, up from 65% for 2024.
- Travelers aged 50-plus expected to spend $6,847, up $188 on the $6,659 budgeted a year earlier.
- 44% of travelers aged 50-plus planned an international trip, up from 37%.
- 50% of travelers aged 50 to 59 preferred flying, against 37% who preferred driving.
Booking, Planning and Travel Technology
AI tools have moved from novelty to a service a majority say they would pay for, while social platforms have gained ground as a source of trip inspiration.
Artificial intelligence AI trip planning is still a minority behavior, but stated willingness to pay for it runs far ahead of current use. Estimates can vary widely - Amadeus puts generative-AI use for trip ideas at 17%, while MMGY reports 42% for a broader definition of AI trip-planning tools.
- In 2025, 17% of US travelers used generative AI tools for trip ideas, up 30% year on year. (Amadeus, n=2,000 US travelers.)
- In 2025, 68% of US travelers said they would pay for an AI travel assistant, at an average of around 6% of total trip cost. (Amadeus.)
Social, mobile and booking channels
- In 2025, 34% of US travelers used social media to find trip ideas, up 21% year on year. (Amadeus.)
- In 2024, 17% of travelers surveyed across five countries — China, Germany, the UAE, the UK and the US — used a travel agent. (McKinsey, n=5,061. This is a global five-market figure, not a US-only one.)
- In 2025, 49% of frequent US business travelers always used corporate booking channels, up from 43% in 2024. (Deloitte.)
Business, Bleisure and Event Travel
Corporate travel budgets are still growing even as fewer professionals are actually on the road, and events have become a bigger reason to fly.
Corporate travel Budget growth and traveler participation moved in opposite directions in 2025.
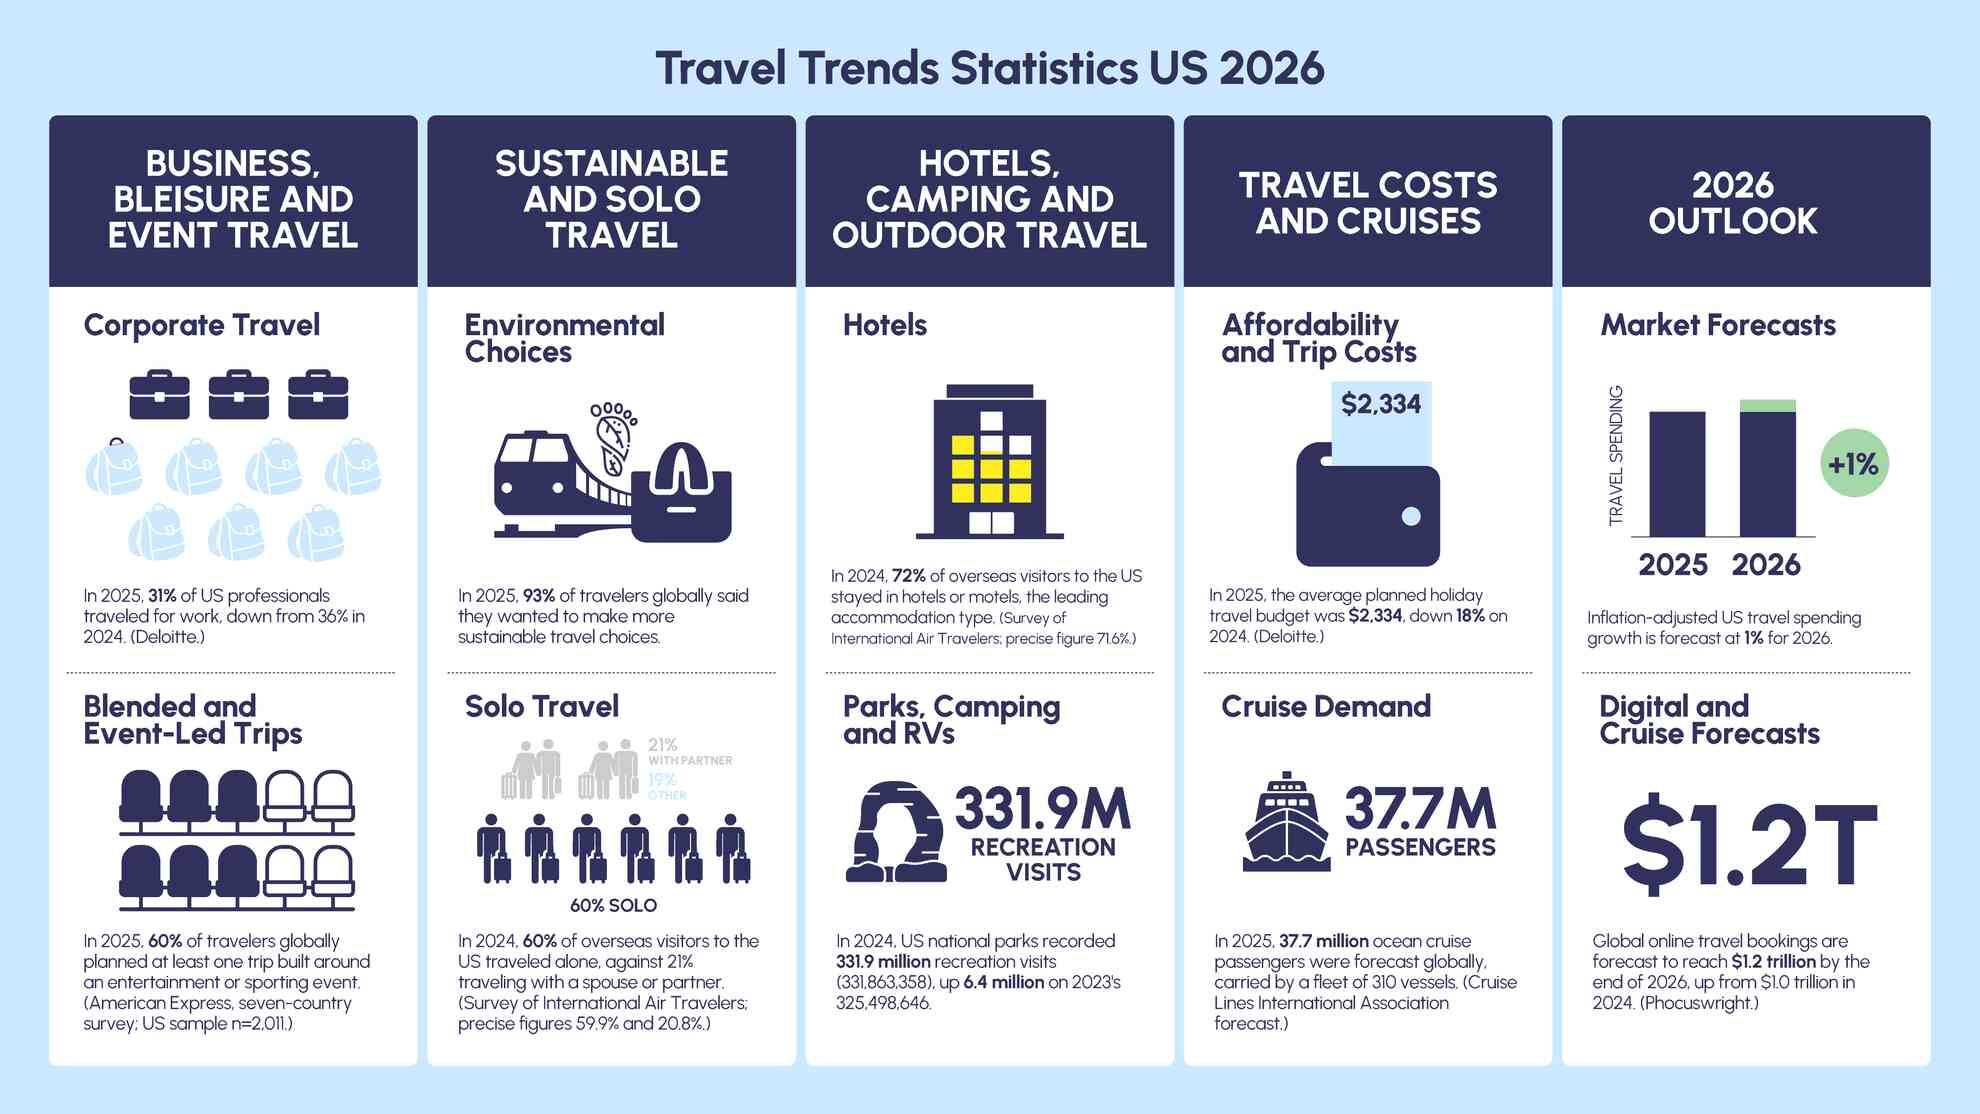
- In 2025, 31% of US professionals traveled for work, down from 36% in 2024. (Deloitte.)
- In 2025, 74% of US travel managers planned to expand travel budgets, easing to 68% for 2026. (Deloitte, n=151 travel managers, July 2025.)
- In 2025, 65% of US business travelers expected to attend a conference. (Deloitte.)
Blended and event-led trips
Entertainment and sporting events are now generating trips of their own.
- In 2025, 60% of travelers globally planned at least one trip built around an entertainment or sporting event. (American Express, seven-country survey; US sample n=2,011.)
- Airbnb searches for Houston stays rose 620% around a single major concert in June 2025, against a 200% rise for Charlotte around a concert in May 2025. (Airbnb search data for specific named events, not a general pattern across all concert dates.)
Sustainable and Solo Travel
Stated demand for lower-impact travel is close to universal in global surveys, while solo trips remain a large segment of inbound visitors.
Environmental choices (global figures) The first three bullets below come from a Booking.com survey of 32,000 respondents across 34 countries and are global, not US-specific. They are also stated intent rather than measured behavior, and come from a company with a commercial interest in the topic.
- In 2025, 93% of travelers globally said they wanted to make more sustainable travel choices.
- In 2025, 73% of travelers globally wanted their spending to benefit local communities.
- In 2025, 39% of travelers globally sought advice on traveling off-peak and 36% globally picked alternative destinations to avoid crowds.
- In 2025, 45% of US travel managers said emissions targets required cutting travel by 20% or more, up from 24% in 2024. (Deloitte — this one is US-specific.)
Solo travel
- In 2024, 60% of overseas visitors to the US traveled alone, against 21% traveling with a spouse or partner. (Survey of International Air Travelers; precise figures 59.9% and 20.8%.)
- 25% of solo leisure travelers said they often traveled with pets, against 19% of leisure travelers overall. (Hilton/Ipsos, 13-country global survey of 13,001 adults, fieldwork June 2024.)
Hotels, Camping and Outdoor Travel
Hotels remain the default for inbound visitors, while camping and RV travel have grown into a mass-market alternative.
Hotels
- In 2024, 72% of overseas visitors to the US stayed in hotels or motels, the leading accommodation type. (Survey of International Air Travelers; precise figure 71.6%.)
- 63% of travelers globally said they wanted to use a digital hotel room key. (Hilton/Ipsos, 13 countries, fieldwork June 2024.)
Parks, camping and RVs Outdoor participation set records in 2024, and RV travel intentions remained high in 2025.
- In 2024, US national parks recorded 331.9 million recreation visits (331,863,358), up 6.4 million on 2023's 325,498,646.
- In 2024, camping generated $61 billion in US spending. (Kampgrounds of America.)
- In 2024, more than 11 million additional US households camped compared with 2019. (Kampgrounds of America.)
- In 2025, 44 million Americans planned summer RV travel, including 92% of RV owners. (RV Industry Association, n=1,700, margin of error ±2.74 points.)
Travel Costs and Cruises
Trip costs split sharply in 2025, with holiday budgets falling while international and overnight trip costs climbed.
Affordability and trip costs Different trip types moved in opposite directions on price during 2025.
- In 2025, the average planned holiday travel budget was $2,334, down 18% on 2024. (Deloitte.)
- In 2025, the average insured international trip cost reached $9,922, up 11% on 2024 and 32% on 2022. (Squaremouth. Insured trips are a self-selected, higher-cost subset — this is not an average across all international trips.)
- In 2025, average one-night trip spending rose to $700, up from $594 in 2024. (Allianz Partners.)
- In 2025, domestic Memorial Day airfare averaged $850 round trip, 2% more than in 2024. (AAA.)
- At Thanksgiving 2025, domestic car rental rates were 15% cheaper than in 2024. (AAA.)
Cruise demand
Cruise volume kept setting records.
- In 2025, 37.7 million ocean cruise passengers were forecast globally, carried by a fleet of 310 vessels. (Cruise Lines International Association forecast.)
2026 Outlook
Forecasts for 2026 point to slow real growth at home and a continued shortfall against 2019 on inbound travel. Every figure in this section is a forecast.
Market forecasts
Real-terms growth is forecast across every vertical, but only at low single digits. All figures are from U.S. Travel's forecast, modelled by Tourism Economics in inflation-adjusted 2025 dollars.
- Inflation-adjusted US travel spending growth is forecast at 1% for 2026.
- Domestic leisure travel spending is forecast at $909 billion in 2026, up 0.9% on 2025.
- Total US business travel spending — domestic and international combined — is forecast at $319 billion in 2026, up 0.7% after inflation. Because this figure is not domestic-only, it should not be added to the domestic leisure figure above to reconcile against the domestic total.
- International arrivals are forecast at 70.6 million in 2026, up 3.4% on 2025 but still below both the 72.4 million recorded in 2024 and the 79 million recorded in 2019. U.S. Travel does not expect 2019 volumes to be regained until 2029.
- International visitor spending is forecast at $178 billion in 2026, up 1.6% on 2025 but 18% below 2019 in real terms.
Digital and cruise forecasts
Online booking share and cruise volume are both projected to keep climbing.
- Global online travel bookings are forecast to reach $1.2 trillion by the end of 2026, up from $1.0 trillion in 2024. (Phocuswright.)
- 65% of global travel gross bookings are expected to happen online in 2026. (Phocuswright.)
- US ocean cruise volume is forecast at 21.7 million travelers in 2026, up 4.5% from 20.7 million in 2025. (AAA. This is a US-resident figure, unlike the global 37.7 million above.)
Sources
All URLs accessed 10 August 2026. Several of these are rolling pages that are overwritten when new data is published — flagged below. If a live page no longer matches the figure quoted here, check an archived snapshot from the access date.
- U.S. Travel Association — Travel Forecasts (2026 forecast, modelled by Tourism Economics). Rolling page, replaced each forecast round. https://www.ustravel.org/research/travel-forecasts
- National Travel and Tourism Office — 2025 Forecast Summary, March 2025. https://www.trade.gov/sites/default/files/2025-03/2025-Forecast-Summary.pdf
- International Trade Administration — International inbound visitor spending, December 2024. https://www.trade.gov/feature-article/december-2024-international-inbound-visitor-spending
- National Travel and Tourism Office — Survey of International Air Travelers: 2024 results. https://www.trade.gov/feature-article/survey-international-air-travelers-results-2024
- Bureau of Transportation Statistics — December 2024 US airline traffic data. https://www.bts.gov/newsroom/december-2024-us-airline-traffic-data-59-december-2023
- Airlines for America — Busy summer travel season highlights urgent need for ATC investment, 29 August 2025 (reporting TSA screening data). https://www.airlines.org/busy-summer-travel-season-highlights-urgent-need-for-atc-investment/
- AAA — Thanksgiving Travel Forecast 2025, November 2025. https://newsroom.aaa.com/2025/11/aaa-thanksgiving-travel-forecast-2025/
- AAA — Memorial Day Travel Forecast 2025, May 2025. https://newsroom.aaa.com/2025/05/memorial-day-forecast/
- Deloitte — 2025 summer leisure travel trends. Path migrated once already; may reslug. https://www.deloitte.com/us/en/insights/focus/transportation/2025-summer-leisure-travel-trends.html
- Deloitte — 2025 holiday travel survey. https://www.deloitte.com/us/en/insights/industry/retail-distribution/holiday-travel-survey.html
- Deloitte — Corporate travel study, 2025, and accompanying release Deloitte corporate travel forecast: a mixed bag amid complex conditions (n=151 US travel managers, July 2025). https://www.deloitte.com/us/en/insights/industry/transportation/corporate-business-travel-survey.html
- American Express — Global Travel Trends Report 2025 (seven countries; US sample n=2,011). https://www.americanexpress.com/en-gb/travel/discover/img/gtt2025/2025_AMEX_GLOBAL_TRAVEL_TRENDS_REPORT_2.pdf
- Phocuswright — $1.2T in online bookings by end of 2026, 2025. https://www.phocuswright.com/Travel-Research/Research-Updates/2025/1-2-T-dollars-in-online-bookings-by-end-of-2026
- McKinsey — The way we travel now, 2024 (five-country global survey, n=5,061, fieldwork February–March 2024). https://www.mckinsey.com/industries/travel/our-insights/the-way-we-travel-now
- AARP Research — 2025 Travel Trends, fieldwork November–December 2024. https://www.aarp.org/pri/topics/social-leisure/travel/2025-travel-trends/
- Bank of America Institute — Vacation Nation, 2025. https://institute.bankofamerica.com/content/dam/economic-insights/vacation-nation.pdf
- Airbnb — Summer Travel Trends, 2025. Dateless slug, reused annually. https://news.airbnb.com/summer-travel-trends/
- Hilton, survey by Ipsos — 2025 Trends Report (13 countries, n=13,001, fieldwork June 2024). https://stories.hilton.com/releases/hilton-travel-trends-2025
- National Park Service — Visitation numbers (2024 data). Rolling page, overwritten annually. https://www.nps.gov/aboutus/visitation-numbers.htm
- Kampgrounds of America — 2025 Camping and Outdoor Hospitality Report (2024 data). https://ownakoa.com/2025/04/09/2025-camping-outdoor-hospitality-report/
- RV Industry Association — RVing remains popular choice for summer travel, 2025 (n=1,700, ±2.74 points). Dateless slug. https://www.rvia.org/news-insights/rving-remains-popular-choice-summer-travel
- Allianz Partners USA, survey by Ipsos — Vacation Confidence Index 2025. https://www.allianzworldwidepartners.com/usa/media-center/press-releases/Summer-vacation-confidence-and-spend-reach-record-highs-despite-ongoing-economic-uncertainty.html
- Squaremouth — 2025 Travel Outlook. https://www.squaremouth.com/press-room/2025-travel-outlook-squaremouth-predicts-travelers-destination-and-spend-trends
- Booking.com — 2025 sustainable travel research (34 countries, n=32,000, fieldwork January 2025). https://news.booking.com/bookingcoms-2025-research-reveals-growing-traveler-awareness-of-tourism-impact-on-communities-both-at-home-and-abroad/
- Amadeus — Gen AI and social media transform how US travelers plan, 2025 (n=2,000 US travelers). https://amadeus.com/en/newsroom/press-releases/amadeus-research-gen-ai-social-media-transform-us-travelers-plan
- MMGY — Portrait of American Travelers, Spring 2025. https://mmgyintel.com/americans-are-traveling-more-in-2025-heres-whats-driving-their-journeys/
- MMGY — Portrait of American Travelers, Summer 2025. https://mmgyintel.com/from-ai-to-the-open-road-mmgys-summer-survey-captures-how-americans-are-traveling-amid-global-headwinds/
- Cruise Lines International Association — State of the Cruise Industry 2025. https://cruising.org/resources/state-cruise-industry-report-2025
- AAA (Auto Club Group) — AAA predicts record 21.7 million to cruise in 2026. Note this is a regional AAA club newsroom, not national AAA. https://newsroom.acg.aaa.com/aaa-predicts-record-217-million-to-cruise-in-2026/